STOCK MARKET VOLATILITY IN INDIA
Dr. V. Pankunni
Indian stock market has been showing trends of volatility over years. The press media and the general public are showing greater amount of anxiety over it. The perceived volatility based on the changes in the stock indices and individual stock prices is considerably higher which has scared off the domestic retail investors from the market. The small and retail investors are still panicky and shy due to the felt volatility of the stock market.
The market indices and the prices of individual stocks listed in the stock markets are subject to frequent fluctuations. The fluctuations in prices and returns are a greater concern for the investors. The changes in prices are the sources of return from stocks, if it is positive. If the prices change negatively, stockholders interest will be adversely affected. The predominant interest of the stockholders in the price change is the direction of change, whether it is negative or positive. The positive change in prices will increase the returns and the negative change will lead to losses. Negative changes in prices have disastrous effects on the wealth of the stockholders.
A large percentage change in the price of stock or market indices is called stock market volatility [Schwert]1. Volatility in stock prices entail a lot of uncertainties to the stock investors. If volatility is predictable the uncertainty can be fixed. But the predictability of volatility is a matter of dispute among the academics and the practitioners. The dispute arises from the question that what causes volatility. The advocates of 'Efficient Market Hypothesis' believe that volatility is unpredictable [Fama]2. According to them volatility in stock prices is due to the arrival of new information to the market. The information may be from micro or macro sources. They may also take place in the form of announcements by the companies. When the information reaches, the market as a whole responds strongly towards it. The market assimilates such information then and there and prices will be adjusted accordingly. This will result in changes in prices. Such information that will prompt shift in prices or market indices are called shocks or surprises. These information are stochastic in nature and restrict prediction because they are absolutely random. On the contrary, the Technical analysts believe that stock price changes or movement are foreseeable from the past behavior of stock prices and details of volume of trade in stocks.
Stock volatility determines the risk of investment in stocks. Greater the stock market volatility, greater will be the systematic risk of the stockholder. In the risk-return space, being risk-averse, the expected return of the stock holder will be linear with the market volatility. Therefore, the expected return of the stocks will be increased along with an increase in stock volatility. When the price rises the deviation from the expected return gets thinner whereas if the price falls the deviation from the expected return will widen. In an upmarket, volatility is lower while on the contrary; in a down market it is higher. Volatility in a bull market is comfortable whereas it is unbearable in a bear market.
Indian stock market has been considered to be highly volatile over years. The press, media and the general public have been overwhelmingly concerned about the volatile situation of the stock market. For that no one can blame them because stock market is a mirror which reflects the general economic condition of a country. Investors take cues from the volatility. It is generally found that when the market is up the volatility is low and volatility is high when the market is down. As a cue it can be said that if the volatility increases the market is tending to recede and if the volatility is decreasing the market is going up.
Sudden changes in price is a shock and when it happens frequently it becomes chaos. Under chaotic conditions investors get panicky, behave irrationally to aggravate further chaos. As a matter of fact, volatility is a creation of market chaos. This uncertainty will enhance the risk of holding stocks. It, in its turn, will raise the required rate of return by lowering the stock price. Extreme volatility may prompt the investors to dispose their holdings. These will all result in further volatility in the market.
Stock volatility is not found stable over period. It takes place in different magnitude and at different time periods. Further, as the efficient market theory hypothesizes volatility is not absolutely random. If it is to be random, the distribution must be normal. But many studies of the recent times reveal that stock price and return distribution is not normal. The distribution has the presence of extreme kurtosis and skewness. If the volatility is random under conditions of normal distribution it will be white noise having zero mean and unity variance N(0, 1). In this case change in price will be identical and independent distribution. Since the distribution is not normal, volatility cannot be supposed to be absolutely random. Table 1 shows the non-normality of the return distribution of the BSE Sensex during the period Jan.2000 – Dec.2014. The return stream was showing a big positive skewness and the distribution had an excess kurtosis. The presence of skewness shows asymmetry in the distribution. Similarly under normality the coefficient of kurtosis will be 3. But here it is more than 3 and is leptokurtic. It all shows that the return is not coming under normal distribution.
Table 1: Summary statistics of BSE Sensex during 2000-2014
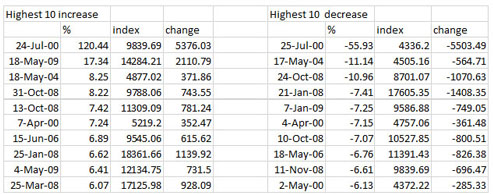
Going through Table 2 it can be found that there is much difference between the percentage change and absolute change. The press, media and the general public customarily keep up anxiety over volatility based on the absolute change. As per Table 2 the volatility in stock market in terms of percentage on an average was below 10% except the first two days on the left and right side of the table. The two days on the increase side and two days on the decrease side were exceptional single day performances of respective years. Barring these four days performance the volatility for the 15 year-period was well below 8.25% on the increase and decrease side. The volatility in Indian stock market was neither lower nor higher.
Statistically volatility is perceived as the dispersion of the actual from the expected past price. In this sense volatility can be estimated by using the statistic standard deviation. Standard deviation represents the dispersion of the actual returns or price from the mean. Volatility will be big or small according to the magnitude of standard deviation. If the standard deviation is low it means that the actual return or price is close to the expected. On the contrary, if the standard deviation is high, the actual is considered to be scattered. Monthly standard deviations can be worked out based on the daily closing stock prices to estimate volatility of the stock prices.
Here, 3739 actual trading days of BSE Sensex has been divided in to 180 monthly intervals with an average of 21 days per month. Standard deviation per month for 21 days are calculated. As the stock prices are not perfectly correlated with the time the standard deviation calculated is multiplied with the root of the total trading days for the month and obtained time adjusted standard deviation to estimate volatility.
Table 3 shows the time adjusted standard deviation of BSE Sensex 30 for 180 months from Jan.2000 to Dec.2014. Standard deviation is the highest in the month of July 2000 with 135.64% and the lowest is 1.74% in the month of November 2014. Figure 1 also depicts the same. The time adjusted standard deviation for the month of July 2000 was showing abnormal volatility. It was only an exceptional behavior. In other months the standard deviation has been comparatively lower. It can be seen from the Figure 1 that the volatility was almost lower for the BSE Sensex for the period except in the year 2000. The average volatility for the entire period was 7%. Removing the exceptional volatility on July 2000 the rate of volatility was 6.3%. Excluding the top 5% increased volatility months, the average rate of volatility comes only 5.75% for the period.
Table 3 : Time-adjusted Standard Deviation of BSE Sensex during 2000-14/Figure 1:Volatility of BSE Sensex
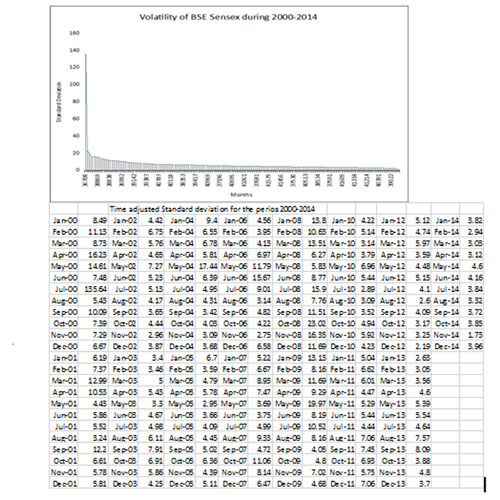
As Figure 1 shows no volatility persistence is found in the BSE Sensex during the period. Volatility is high only in one month. The other months did not follow the high volatility. The volatility decayed immediately at a faster rate. After the singular rise in volatility there was no further increase of standard deviation during the entire period. Figure 1 tells the fact that higher volatility is not followed by higher volatility for a prolonged period and lower volatility is not followed by lower volatility for a prolonged
period. Higher volatility was found only once in a particular month that was on July 2000 and it was not followed by subsequent months. The remaining months had only lower volatility which could be considered as normal up to the end of the study period. It is a clear evidence that there has not been any volatility clustering in Indian Stock market especially in the case of BSE Sensex during the 15 years.
The study of volatility of Indian stock market based on the daily closing price of BSE Sensex for the period from 2000 to 2014 revealed that there was wide difference between the change in prices expressed in points and the change in prices expressed in percentage. The acrimony of the press, media and the public about the volatility of Indian Stock market based on the quantitative change in prices ignoring the real change in terms of percentage is misleading. Barring some exceptional single day large changes Indian stock market has been found with only moderate volatility. When the volatility was studied with the statistic standard deviation it was exceptionally high only in one month that is in July 2000 out of 180 months during the period. All the other months had an average of 6.31% standard deviation. The overall standard deviation for the 15 years period was 7%. During the period of great depression (1929-39) the standard deviation was recorded at 20%. During the period of the recent economic crash (1987-1997) the standard deviation was recorded at 10%. But in India for the last 15 years the volatility measured by standard deviation was only 7%. It means the market volatility in India is not severe or alarming and have no traces of it leading to an economic crash or recession. The market volatility is moderate throughout the period. There were no traces for volatility persistence in Indian stock market. There were no evidences for the existence of volatility clustering. High volatility was not followed by high volatility for a prolonged period (See Fig.1). Even when there was high volatility during 2000 it was decayed fast and the normalcy prevailed undisturbed for long till the end of December2014.

|